

Translate this page into:
An experimental study to diagnose coronary artery disease using five treadmill scores

-
Received: ,
Accepted: ,
How to cite this article: Thirumurugan E, Gomathi K, Swathy P, Ali Afrin HS, Momeen T, Famitha R, et al. An experimental study to diagnose coronary artery disease using five treadmill scores. Glob J Health Sci Res 2023;1:150-4.
Abstract
Objectives:
Exercise is the first step of a cardiovascular stress test, including electrocardiography (ECG) and blood pressure monitoring. Typically, a treadmill or bicycle is used to carry out the exercise for this stress test. Computer-derived criteria and a scoring system have been proposed and tested in hopes of improving the diagnostic accuracy of the exercise ECG for diagnosing coronary artery disease (CAD). Many treadmill scores have not been compared with one another in the same population, so questions remain concerning their diagnostic accuracy. The study aimed to correlate the diagnostic accuracy of ST segment response with various treadmill scores.
Material and Methods:
A total of 100 consecutive patients with suspected CAD referred for exercise testing at ACS Medical College and Hospital, Chennai, Tamil Nadu, between December 2021 and June 2022 were included in the study. The Institutional Review Board approved the study protocol at our institution, and all patients provided written informed consent. A treadmill test was conducted using commercially available equipment. All patients were subjected to symptom-limited exercise testing following the standard Bruce and modified Bruce protocols. A series of five scores were calculated using data collected from the patients to calculate the probability of CAD occurrence.
Results:
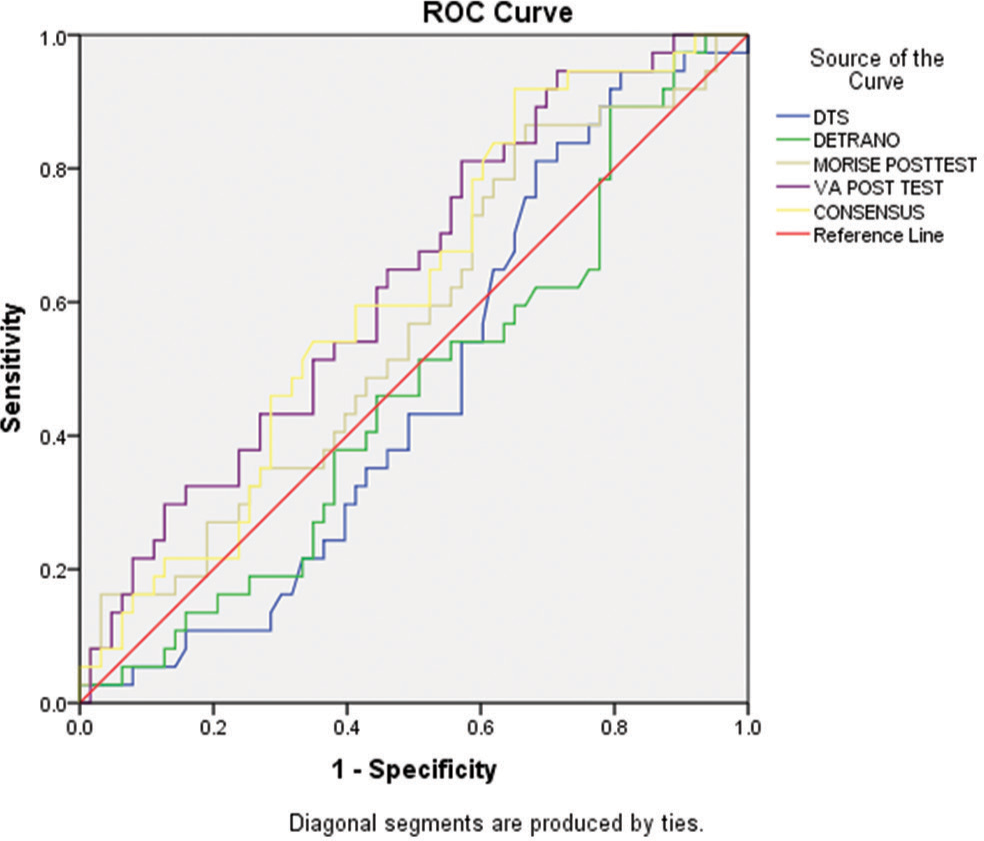
The study included 100 patients with an average age of 48.4 ± 1 years. Obesity (41%), hypertension (80%), diabetes (86%), current smokers (62%), family history of CAD (46%), and hypercholesterolemia (46%) were all observed in the study. The receiver operator characteristic (ROC) plot’s area under the curve (AUC) (standard error) for the Detrano score was 0.46 ± 0.59. This was significantly lower than the AUC of each treadmill score. The AUC of the ROC plots of the Duke treadmill score (DTS), veterans affairs (VA), and consensus scores were 0.47 ± 0.58, 0.63 ± 0.56, and 0.61 ± 0.57, respectively.
Conclusion:
The Morise score remains helpful in our study population for detecting CAD and determining risk strata. DTS and Detrano had comparable accuracy when calculated from intermediate and high probability scores and ST responses (44% and 43%, respectively). VA and consensus had lower accuracy than others (37% and 29%, respectively).
Keywords
Cardiovascular stress test
ST response
Diagnostic accuracy

INTRODUCTION
Atherosclerosis is a condition caused by plaque accumulation inside the arteries’ walls that supply the myocardium (the heart muscle). The result is coronary heart disease (CHD), also known as coronary artery disease (CAD) and atherosclerotic heart disease (atherosclerosis).[1] Symptoms and signs of CHD may be noticeable only at an advanced stage, but most individuals with CHD show no signs or symptoms for decades as the disease progresses before symptoms are present, often a sudden heart attack.[2] With time, some of these atheromatous plaques may rupture and (in combination with the activation of the blood clotting system) begin to block blood flow to the heart. This disease is the most common sudden death cause globally.[3]
The master two-step exercise test was used before developing the Bruce protocol. This test involves the patient repeatedly climbing on and down from a small platform to obtain an electrocardiogram, a test that can be too strenuous for some patients.[4,5] As Dr. Bruce first described the stress test in 1963, he recognized angina as painful chest pain while exercising due to CAD, a previous myocardial infarction, or a ventricular aneurysm. It is still widely accepted that the exercise treadmill test (ETT) can diagnose underlying CAD and determine the patient’s maximal functional aerobic capacity, a term coined by Dr. Bruce himself.[6]
An exercise test, or cardiovascular stress test, involves exercise followed by electrocardiography (ECG) and blood pressure monitoring. This type of stress test is usually administered using a treadmill or bicycle to perform the exercise.[7] Exercise increases sympathetic stimulation and vasomotor tone in the coronaries, affecting coronary blood flow. Several studies reported that the coronaries dilate during exercise. Several mechanisms have been linked to this dilation, including the release of vasoactive substances from the endothelium due to increased oxygen consumption in the heart, passive relaxation caused by increased coronary artery pressure, and endothelium-mediated restriction. Myocardial oxygen demand rises during exercise, and coronary vasodilation increases oxygen delivery, significantly improving myocardial perfusion and preventing ischemia. As stenotic vessels do not dilate as much as normal vessels, we can identify ischemia through this hyperemic effect.[8]
In response to exercise, there is an increase in skeletal muscle blood flow and a decrease in peripheral resistance, increasing systolic blood pressure, mean arterial pressure, and pulse pressure. Diastolic blood pressure may remain unchanged. As a result, it is possible to determine the adequacy of stress on the heart to induce ischemia.[9] Typically, the goal is 85% of the patient’s age-predicted maximum heart rate, calculated by subtracting the patient’s age from 220. Computer-derived criteria and a scoring system have been proposed and tested in hopes of improving the diagnostic accuracy of the exercise ECG for diagnosing CAD. Many treadmill scores have not been compared with one another in the same population, so questions remain concerning their diagnostic accuracy.[10]
MATERIAL AND METHODS
A total of 100 consecutive patients with suspected CAD referred for exercise testing at ACS Medical College and Hospital, Chennai, Tamil Nadu, between December 2021 and June 2022 were included in the study [Table 1]. The Institutional Review Board approved the study protocol at our institution, and all patients provided written informed consent. Study exclusion criteria included patients with prior revascularization, left bundle-branch block, paced rhythms, or Wolff–Parkinson– White syndrome on resting ECG or valvular heart disease.
| Clinical variables | Sample (n=100) |
|---|---|
| Age | 48.43±11 |
| Male | 68% (68) |
| Female | 32% (32) |
| Body mass index | 26.82±3.6 |
| Obesity | 41% (41) |
| Hypertension | 80% (80) |
| Diabetes | 86% (86) |
| Family history of CAD | 46% (46) |
| Current smoker | 62% (62) |
| Hypercholesterolemia | 46% (46) |
CAD: Coronary artery disease
Exercise treadmill testing
A treadmill test was conducted using commercially available equipment. All patients underwent symptom-limited exercise testing following the standard Bruce and modified Bruce protocols. Resting heart rate, blood pressure, and 12-lead ECGs were recorded in the supine and upright positions before exercise. Heart rate and blood pressure measurements and a 12-lead ECG were recorded every minute during exercise. An exercise test was terminated if exertional hypotension, malignant ventricular arrhythmias, or severe ST depression (>2 mm) were observed. The ST response was characterized as a depression of the ST segment of more than 1 mm in a horizontal or downward direction or an ST-segment elevation of more than 1 mm in leads devoid of pathological Q waves (excluding aVR leads).
Treadmill scores
A series of five scores were calculated using data collected from the patients to calculate the probability of CAD occurrence. A Duke treadmill score (DTS), a Detrano score, a Morise score, a Veterans affairs (VA) score, and a consensus score were used in our study. Each score determines the probability of CAD by a formula using patient information and data from exercise treadmill testing.
DTS
The DTS was calculated as DTS = exercise time – (5 * ST deviation) – (4 * exercise angina), with 0 = none, 1 = non-limiting angina, and 2 = exercise limiting angina.
Detrano score
The Detrano equation components are as follows:
Detrano = 1.9 + (0.025 * Age) − (0.6 * Sex) - (0.1 * Symptoms) − (0.05 * Metabolic Equivalents) − (0.02 * Maximal Heart Rate) + (0.36 * Exercise Induced Angina) + (0.6 * Depression in Millimeters).
Sx was coded as 1 for female and−1 for male, symptoms were classified into the four categories of typical, atypical, nonanginal pain, and no pain and coded with values 1, 2, 3, and 4, respectively. Exercise angina was coded as 1 for presence and −1 for absence.
Morise score
The Morise pre-exercise test intercept and variables are as follows:
Morise (pre) = −3.6 + (0.08 * Age) − (1.3 * Sex) + (0.6 * Symptoms) + (0.7 * Diabetes) + (0.3 * Smoking) − (1.5 * BSA) + (0.50 * Estrogen) + (0.3 * No. Of Risk factors) − (0.40 * Resting ECG).
Sex was coded as 1 for female and 0 for male. Symptoms were classified into the four categories of typical, atypical, nonanginal pain, and no pain and coded with the values 4, 3, 2, and 1, respectively. Diabetes was coded as 1 if present and 0 if absent. Smoking was coded as 2 for current smoking, 1 for any previous smoking, and 0 for never smoked. Estrogen was coded as 0 for men and, for women, 1 for estrogen-negative (postmenopausal and no estrogen) and −1 for estrogen-positive (premenopausal or taking estrogen). Risk factors included history of hypertension (HTN), hypercholesterolemia, and obesity (body mass index [calculated as weight in kilograms divided by the square of height in meters], 27). Resting electrocardiogram was coded as 0 if normal and 1 if there were QRS or ST-T wave abnormalities.
The Morise post-test equation is as follows:
Morise (post) = −0.12 + (4.5 * Pre-test) + (0.37 * ST Depression in Millimeters) + (1.0 * ST Slope) − (0.4 * Negative ST) − (0.016 * Maximal Heart Rate).
Pre-test is the pre-test probability (0–1) derived from the pre-test equation. ST depression in millimeters was coded as0 for women. ST slope was coded as 1 for down-sloping and 0 for up-sloping or horizontal. Negative ST was coded as 1 if ST depression was <1 mm of depression horizontal or down-sloping or if ST depression was <1.5 mm of upsloping.
VA score
The pre-exercise test equation, 17 including the chosen variables and their coefficients and the constant, is as follows:
VA Score = −2.1 + (0.03 * Age) − (0.4 * Symptoms) + (0.8 * Diabetes) + (0.4 * Hypercholesterolemia) + (0.01 * Pack-years) + (0.7 * Resting ST Depression in Millimeters).
The post-exercise test equation, including the chosen variables, their coefficients, and the constant, is as follows:
VA score = −1.2 + (3.3 * Pre-test) + (0.5 * Exercise ST Depression in Millimeters) + (0.6 * ST Slope) − (0.16 * Metabolic Equivalents) − (0.5 * Exercise Angina), where pre-test is a number between 0 and 1 generated by the pre-test equation.
Consensus score
Consensus score is the average of Detrano, Morise, and VA scores together.
Statistical analysis
The area under the curve (AUC) for each treadmill score was compared to the AUC for the ST response alone and the other treadmill scores. The predictive accuracies of the DTS, Detrano, Morise, VA, and consensus scores were calculated and compared to stratify patients into the high, intermediate, or low likelihood of CAD. The Kappa statistics were used to compute the test of agreement. A statistically significant difference in predictive accuracy is defined as P = 0.05 using the two-tailed Fischer’s exact test. SPSS version 20.0 was used to perform statistical analysis.
Data from this section are depicted in Table 2. The receiver operator characteristic (ROC) plot’s AUC (standard error) was 0.461 ± 0.59 for the Detrano score. This was significantly higher than the AUC of each treadmill score. The AUC of the ROC plots of the DTS score, VA score, and consensus score were 0.56 ± 0.60, 0.55 ± 0.60, 0.58 ± 0.60, respectively, and did not differ significantly.
| Treadmill scores | Area under the curve |
|---|---|
| Duke treadmill score | 0.47±0.58 |
| Detrano score | 0.46±0.59 |
| Morise score | 0.56±0.59 |
| Veterans affairs score | 0.63±0.56 |
| Consensus score | 0.61±0.57 |
RESULTS
The study included 100 patients with an average age of 48.4 ± 1. Baseline characteristics were calculated based on clinical factors such as obesity (41%), HTN (80%), diabetes (86%), current smokers (62%), family history of CAD (46%), and hypercholesterolemia (46%).
Data from this section are depicted in Table 2. The ROC plot’s AUC (± standard error) was 0.46 ± 0.59 for the Detrano score. This was significantly lower than the AUC of each treadmill score. The AUC of the ROC plots of the DTS score, VA score, and consensus score were 0.47 ± 0.58, 0.63 ± 0.56, and 0.61 ± 0.57, respectively.
DTS and Detrano had comparable accuracy when calculated from intermediate and high probability scores and ST response alone (44% and 43%, respectively). Morise’s accuracy was around 48% when calculated in a similar way. The Chi-square testing indicates that this result is highly significant (P = 0.04). VA and Consensus had similar accuracy when calculated from intermediate and high probability scores and ST response alone (37% and 29%, respectively).
DISCUSSION
With the advent of the modern computer era, several probability scores have been created for determining the probability of the presence or absence of CAD. In research conducted by Fearon et al., they studied 1282 consecutive male patients with complete data who underwent exercise treadmill testing. The DTS is helpful in diagnosing CAD in this population as it is more accurate than other treadmill scores.[11]
According to the present study, DTS and Detrano had similar accuracy (44% and 43%), whereas VA and consensus had low precision (37% and 29%). In light of this, our research demonstrates that the Morise score (P = 0.04/48%), which is more significant than other scores, accurately predicts the likelihood of CAD [Table 3].
| ETT score | Risk/probability | ST response | P-value | Accuracy (TP + TN/total cases) taking inter -mediate and high probability (%) | |
|---|---|---|---|---|---|
| Negative | Positive | ||||
| DTS | Low | 0 | 0 | 0.23 | 44 |
| Intermediate | 16 | 35 | |||
| High | 21 | 28 | |||
| Detrano | Low | 0 | 0 | 0.24 | 43 |
| Intermediate | 35 | 55 | |||
| High | 2 | 8 | |||
| Morise | Low | 0 | 2 | 0.04 | 48 |
| Intermediate | 6 | 19 | |||
| High | 31 | 42 | |||
| VA | Low | 23 | 37 | 0.23 | 37 |
| Intermediate | 16 | 26 | |||
| High | 2 | 1 | |||
| Consensus | Low | 5 | 12 | 0.09 | 29 |
| Intermediate | 24 | 46 | |||
| High | 8 | 5 | |||
DTS: Duke treadmill score, CAD: Coronary artery disease, ETT: Exercise treadmill test, VA: Veterans affairs
CONCLUSION
Using the ETT, particularly treadmill scores, to stratify patients for the probability of CAD is a fundamental approach in this money-conscious era. Consequently, a low-cost test may identify CAD by applying this fundamental strategy. However, finding the most accurate ways to integrate clinical and exercise test data for CAD diagnosis is critical.
The Morise score remains useful for detecting CAD and determining risk strata in our study population. DTS and Detrano had comparable accuracy when calculated from intermediate and high probability scores and ST responses (44% and 43%, respectively). VA and consensus had lower accuracy than others (37% and 29%, respectively). The considerable limitation of this study is the specific population to which the treadmill scores were applied.
Acknowledgments
Researchers thankfully acknowledge Dr. Kalpana Devi, Principal, and Dr. Kalavathy Victor, Director of Allied Health Science of Dr. M.G.R. Educational and Research Institute for active guidance.
Declaration of patient consent
The authors certify that they have obtained all appropriate patient consent.
Conflicts of interest
There are no conflicts of interest.
Financial support and sponsorship
Nil.
References
- Epidemiology of coronary heart disease and acute coronary syndrome. Ann Transl Med. 2016;4:256.
- [CrossRef] [PubMed] [Google Scholar]
- Atherosclerosis: Process, indicators, risk factors and new hope. Int J Prev Med. 2014;5:927-46.
- [Google Scholar]
- Robert Arthur Bruce, MD. Exercise cardiology. Circulation. 2005;111:2410-1.
- [CrossRef] [PubMed] [Google Scholar]
- Exercise testing. Ann Noninvasive Electrocardiol. 2004;9:199-200.
- [CrossRef] [PubMed] [Google Scholar]
- Stress testing: A contribution from Dr Robert A. Bruce, father of exercise cardiology. BC Med J. 2016;58:70-6.
- [Google Scholar]
- The role of treadmill exercise testing in women. J Nucl Cardiol. 2016;23:991-6.
- [CrossRef] [PubMed] [Google Scholar]
- Regulation of coronary blood flow during exercise. Physiol Rev. 2008;88:1009-86.
- [CrossRef] [PubMed] [Google Scholar]
- Treadmill stress testing In: StatPearls. Treasure Island, FL: StatPearls Publishing; 2022.
- [Google Scholar]
- 85% of maximal age-predicted heart rate is not a valid endpoint for exercise treadmill testing. J Nucl Cardiol. 2011;18:1026-35.
- [CrossRef] [PubMed] [Google Scholar]
- A comparison of treadmill scores to diagnose coronary artery disease. Clin Cardiol. 2002;25:117-22.
- [CrossRef] [PubMed] [Google Scholar]


